Finviz (Financial Visualizations) is an online stock screener and market visualization tool widely used by investors and traders to find trading ideas. Its intuitive interface blends fundamental and technical data for quick analysis.

In fact, Finviz is often highlighted in “best screener” roundups for its extensive filters, even including unique fields like IPO date and outstanding shares.
Whether you’re a beginner or experienced trader, Finviz helps you scan thousands of stocks and ETFs with rich output and visual cues (charts, heatmaps, and more) to make informed decisions.
Key Features of Finviz
- Stock Screener: Finviz’s core feature lets users filter stocks by descriptive criteria (sector, industry, country, market cap), fundamental ratios (P/E, PEG, dividend yield, EPS, etc.), and technical indicators (price performance, RSI, patterns). You can combine filters in one view and quickly update results.
- Heatmaps/Maps: The Maps section shows interactive heatmaps of market indices or sectors (e.g., S&P 500), color-coded by performance. This visual overview makes it easy to spot sector leaders and laggards at a glance.
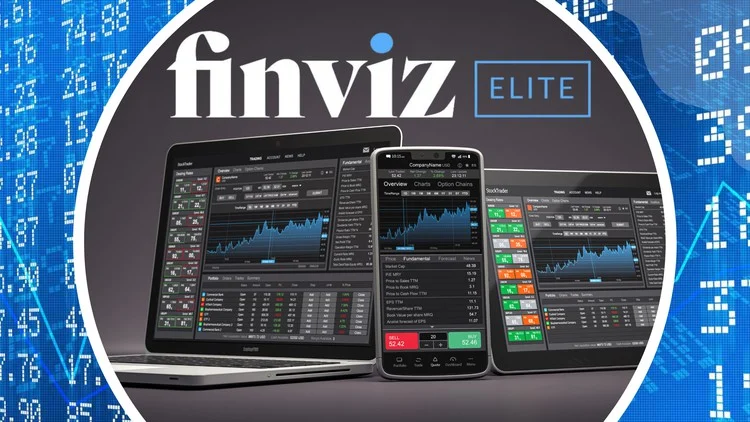
- Charts and Snapshots: Clicking or hovering on a ticker reveals a price chart thumbnail. (Finviz’s hover-preview of charts is a “long-standing staple” of the platform.) The free version offers basic daily charts, while Finviz Elite adds intraday multi-layout charts, technical studies, and real-time data.
- News Feed: A consolidated news section provides market headlines and company-specific news, helping traders stay updated on events and trends affecting their filters.
- Insider Trading Data: Finviz tracks SEC Form 4 filings and lists recent insider buys and sells, which traders can screen to spot unusual insider activity. The homepage also highlights “Top Insider Trading” deals.
- Groups & Sectors: The Groups feature aggregates performance by industry and sector, letting you compare and sort entire groups (e.g., which industries have the best P/E ratios or year-to-date returns).
- Portfolio/Watchlists: Registered users can create watchlists and portfolios. You see an interactive map of your holdings, personalized news, and performance metrics in one place.
- Other Markets: Separate tabs cover Futures, Forex, and Crypto, with quotes and charts.
- Backtests and Alerts (Elite): Finviz Elite subscribers get backtesting tools, email/push alerts (for news, ratings, insider trades, etc.), and the ability to export data or use APIs.
How to Use the Finviz Screener
- Open the Screener: Click “Screener” on the top menu. You’ll see filter panels (Descriptive, Fundamental, Technical).
- Choose Descriptive Filters: Select broad filters first. For example, pick a Sector (e.g., Technology) and Market Cap range (Large Cap, Mid Cap, etc.) to narrow down companies by industry and size.
- Add Fundamental Filters: Under the Fundamental tab, set parameters like P/E (Price/Earnings), PEG, Dividend Yield, or EPS growth. For instance, you might screen for stocks with a P/E under 20 and a yield over 2%.
- Add Technical Filters: In the Technical tab, you can include price performance and indicators. For example, filter by Average Volume or Relative Volume to ensure liquidity, or set RSI (Relative Strength Index) to find oversold/overbought conditions. You can also filter by price range or chart patterns (such as “Head & Shoulders”).
- View Results: The table updates instantly, showing tickers and key data. Click any ticker to open a detailed overview with charts and news. Hovering over the symbol shows a quick chart thumb.
- Save Your Screen: Create a free account to save this combination of filters as a preset. This makes it easy to rerun your search later without rebuilding filters.
Finviz vs. Other Tools
Compared to other platforms, Finviz’s strength is its comprehensive filtering and visualizations. For example, Yahoo Finance’s screener has a cleaner interface and ESG filters, but fewer specialized criteria.
TradingView offers superior interactive charting and a friendlier UI (with global stocks, forex, crypto filters) – great for technical analysis – but its stock screener is less focused on fundamental breadth.
MarketWatch and similar sites provide news and basic charts, but have more limited screening. In contrast, Finviz stands out as a free, powerful screener (with an Elite upgrade for real-time data and advanced tools).
NerdWallet notes Finviz “is often included in roundups of the best stock screeners…[offering] many filters…without clicking through pop-ups”.
Tips for Traders Using Finviz
- Save Presets: After logging in, save your favorite filter combinations. This lets you quickly revisit screens without reselecting filters.
- Use Chart Previews: Hover over tickers to see instant charts. This lets you scan technical trends at a glance without leaving the screener.
- Leverage Heatmaps: Regularly check the Maps/Groups views to spot sector trends and overall market sentiment (green/red signals).
- Monitor Insider and News: Keep an eye on insider trades and news headlines. Unusual insider buying or relevant news stories from Finviz can highlight opportunities.
- Combine Filters: Mix fundamental and technical criteria (e.g., low P/E + RSI oversold) to fine-tune your search. Experiment with different combos to find unique ideas.
- Explore Elite Features: If you need faster data or more tools, Finviz Elite adds real-time quotes, advanced charts, email alerts, and the ability to export data.
Conclusion
Finviz.com is a robust, beginner-friendly platform for smarter investing. Its easy-to-use screener and rich visual tools (heatmaps, charts, news) help traders quickly sift through thousands of stocks.
By integrating fundamental and technical filters and providing clear visual outputs, Finviz makes complex market data “easy to digest”.
Whether you’re a casual investor or a swing trader, Finviz can streamline research, saving preset screens, spotting trends with heatmaps, and monitoring key data – all of which can support smarter, more informed investment decisions.
Sources: Official Finviz help pages and market reviews.